If you have any questions or need help creating the trial you can find help here: Field Trial Module (Trial Creation).
How to Create a Field Trial Analysis
- Select Analysis Wizard, Field Trial, and hit Add
- Start off by giving a name and description and hit Next.
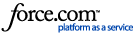
- In the Trial Datasets window you will need to select the following:
- The Trial you want to run.
- The Year and Field: This helps to understand which fields had this trial on them.
- Result Dataset: This will auto default to the selected year’s harvest data as it is the most common one to analyze. This can be changed to whatever layer you’d like.
- As Applied Dataset (Optional): This is beneficial to show the actual applied rates rather than the trial target as these can vary from each other, and it will allow you to automatically pull in financial tracking data for those layers.
- Grouping Item (Optional): This helps to break the report down into more groups such as: Soil Type, Management Zones, etc.
- (Note: These are all reference datasets and as with other analyses you can run this on any field you want and not just the one selected in the setup.)
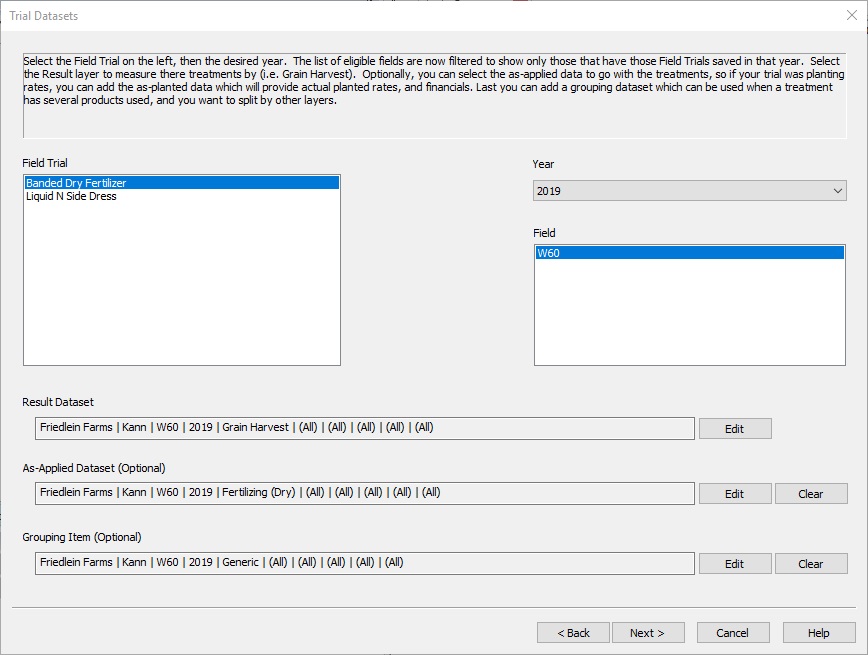
- Next we’ll need to fill out the Report Summary settings. These settings will all be set to the recommended defaults, so nothing is required to be set here. These can also be edited after setting up the template and running the analysis. Hit change to edit any one of the following:
-
- Trial Information:
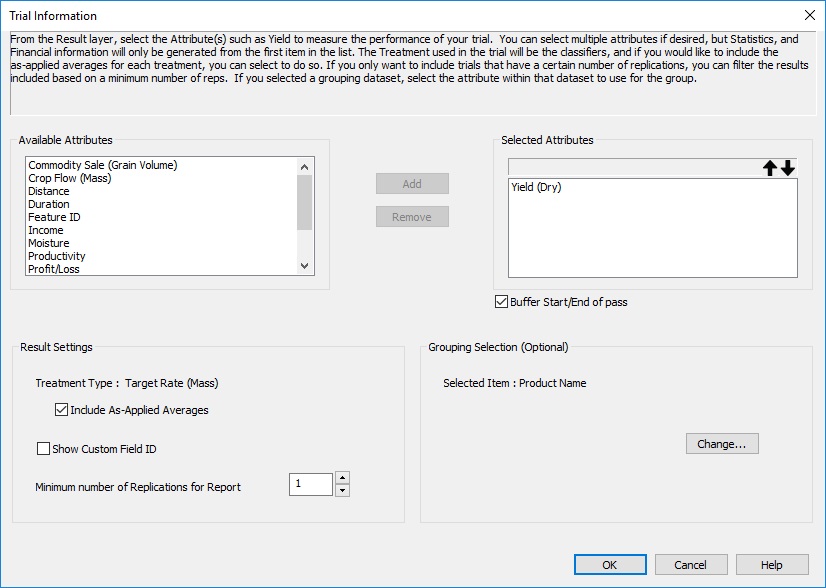
- Below is where you’ll need to select the result attribute and other related attributes. You’ll need to make sure the result attribute is at the top of the list on the right.
-
- Check Buffer Start/End of pass if you’d like to use the buffer you set when creating your original trial.
- Select Show Custom Field ID to hide the field names in the report and replace them with your Custom Field ID.
- You can also select the minimum number of replication needed for the report. Treatments that don’t meet these minimums will not be displayed in the report.
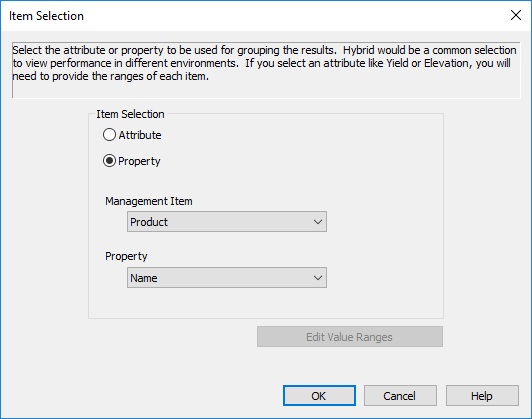
- Select Change to modify the grouping attribute you’d like to use.
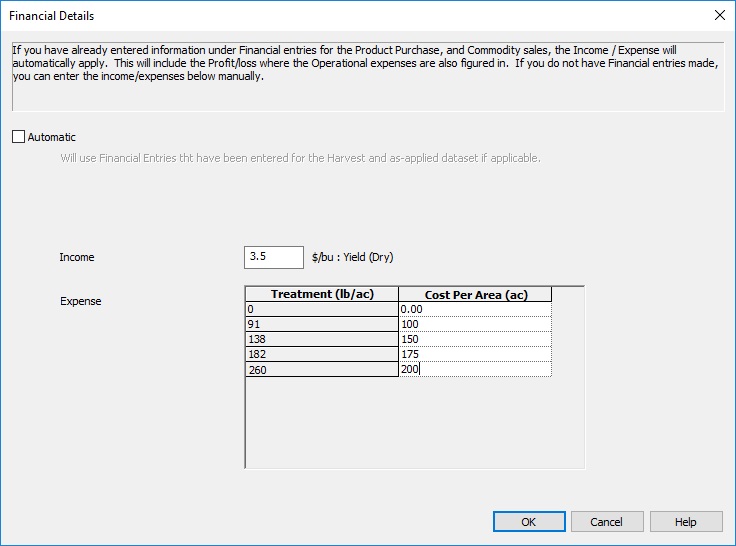
- Financial Details: If this is checked your report will show the economic value of your trials based off your as-applied data. If you check Automatic the analysis will use the values found in Financial Tracking. If you uncheck Automatic you’ll need to manually fill out your Income and Expense for the trials as shown below.
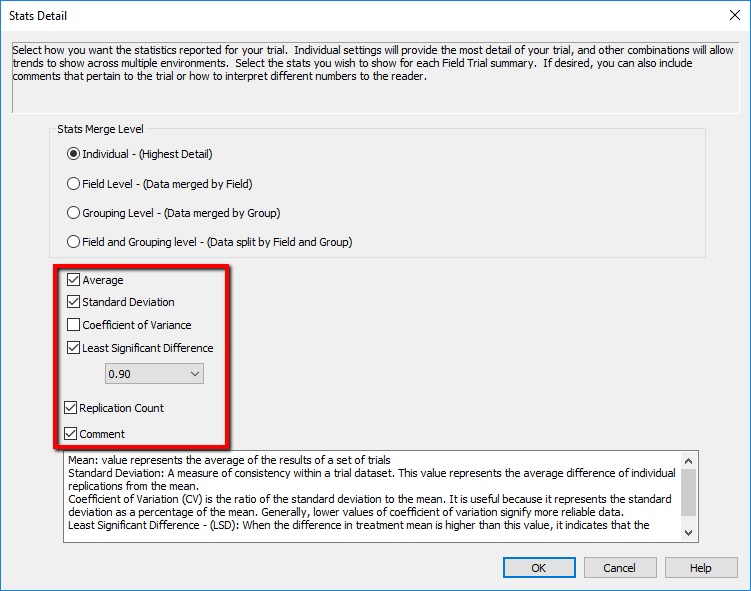
- Stats Details: Here you can choose between four merge levels to show your statistics. Individual will give you the highest level of detail and include all maps and charts, Field Level will merge the data by field and won’t show individual treatments or maps, and Grouping Level will show how your treatments did by the grouping attribute you selected earlier in Trial Information. By selecting change you can also select which stats to view as shown below. They will show in the report as shown on step 5B.
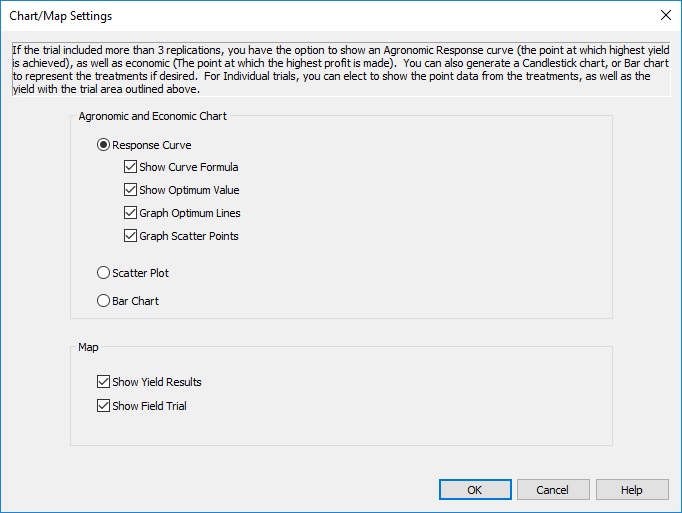
- Chart/Map Settings: Here you can select between three unique charts, and whether to show yield results and your field trial on the map.
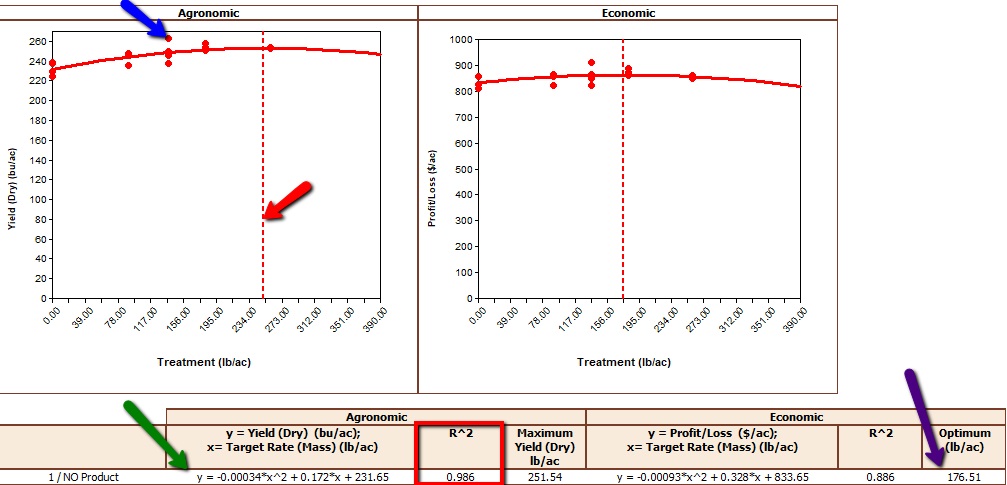
- Response Curve: This option is only available if your trial contains at least 4 unique rates. You can also choose to show the curve formula (green arrow), optimum value (purple arrow), optimum lines (red arrow), and scatter points (blue arrow) shown in outlined in 5C. The red box is a confidence interval; the close the number is to 1 to more reliable the number is.
- Scatter Plot will only show the scatter points and nothing else from 5C
- Bar Graph
-
- After completing the setup of the field trial you can then run the report. The report can be run as a single field, multiple fields, or over multiple projects. Below explains what different areas of the analysis means.
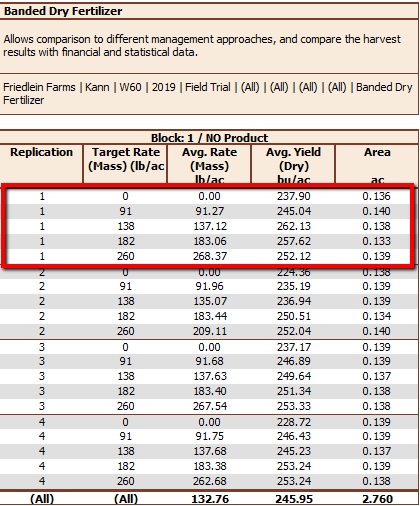
- The block summary will show each block by the trial information selected from 4A. If you selected Individual for your merge level it will show each individual replication, the amount of product applied (target and actual), as well as how that area yielded.
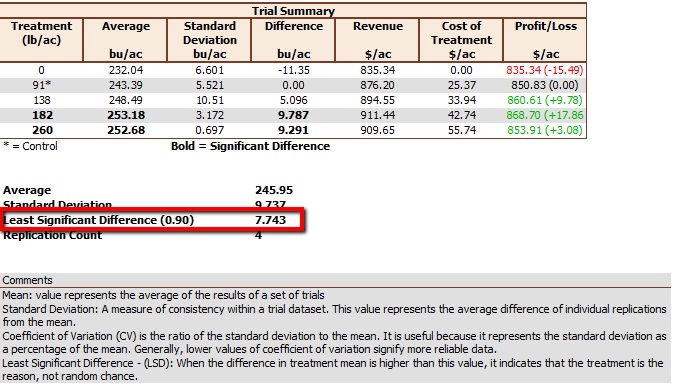
- The Trial Summary shows the profit loss details of each treatment and whether the profit loss was a significant difference. If you had a least 3 replications the trial will give a least significant difference (LSD) value. This value helps to identify whether the change in yield was significant enough to indicate the treatment caused the change. For example: Below, our LSD is 7.743 bu/acre with a .9 confidence interval. This means that we are 90% confident that a change of 7.743 bu/acre was due the treatment and not random chance. The treatments that fall into this category are bolded in the chart.
- Below displays what our chart will look like if we’re using a response curve (See 4D).
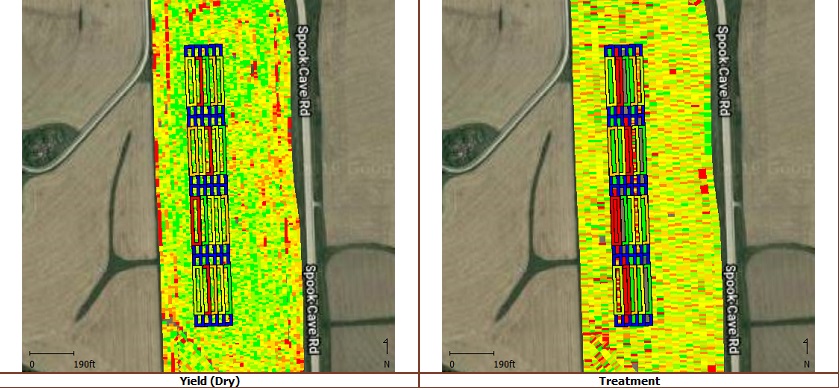
- Below shows a map of the treatment area and where the treatments were placed. The blue areas of the trial indicate the buffer area.