It is highly recommended to have all the grain harvest maps cleaned up and updated before running this analysis for more accurate results.
If importing shape files, Yield Mass Dry and Yield Volume Dry are both required for the Yield Analysis to run. If you only select Yield Volume Dry, the analysis will not run.
Note: This analysis is currently only used with grain harvest. It cannot be used with forage, bailing or cotton harvest data.
-
Select Analysis Wizard.
-
Select Yield Analysis.
-
This analysis does not save custom settings/setup. Select “Single Field” or “Multiple Fields”.
-
Select the Data Filters. Select desired Grower, Farm, Field, Year, Operation and Crop Type. Click Next.
-
Note: Only a single crop type and year can be selected.
-
If needed, delete unwanted datasets from the list in the Edit Data Filter Results. Click Next.
-
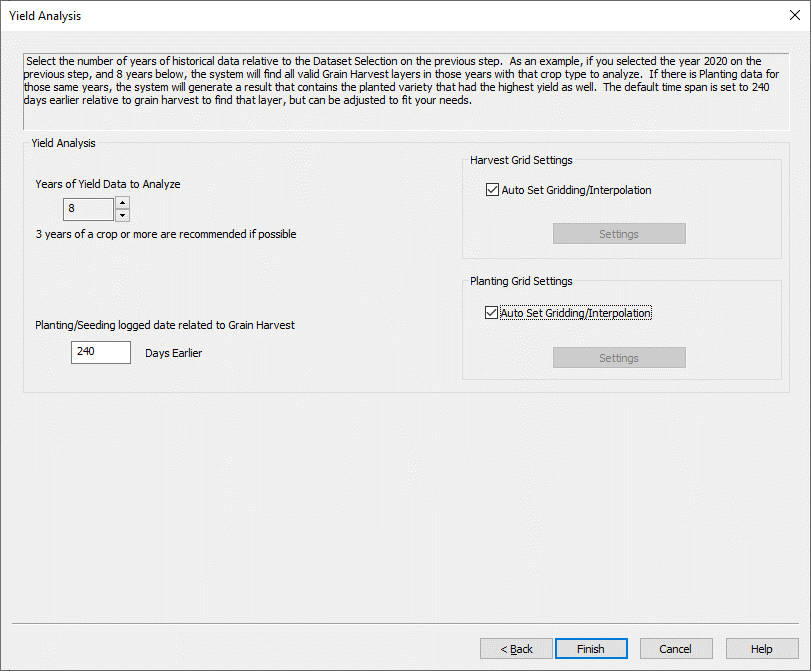
In the Yield Analysis window adjust desired settings:
-
Select the number of Years of Yield Data to Analyze (SMS defaults to 8 years). SMS will find valid Grain Harvest layers in those years with the crop type selected to analyze.
-
Under Planting/Seeding logged date related to Grain Harvest select the number of days before harvest the planting operation happened for this field. The default time is set to 240 days earlier than harvest. If there is Planting or Seeding data for the years in analysis, SMS will search for the most recent planted layer for each year and generate a result that contains the planted variety that had the highest yield.
-
Harvest and Planting Grid Settings can he changed by unchecking “Auto Set Gridding/Interpolation” and select “Settings”.
-
Select Finish.
-
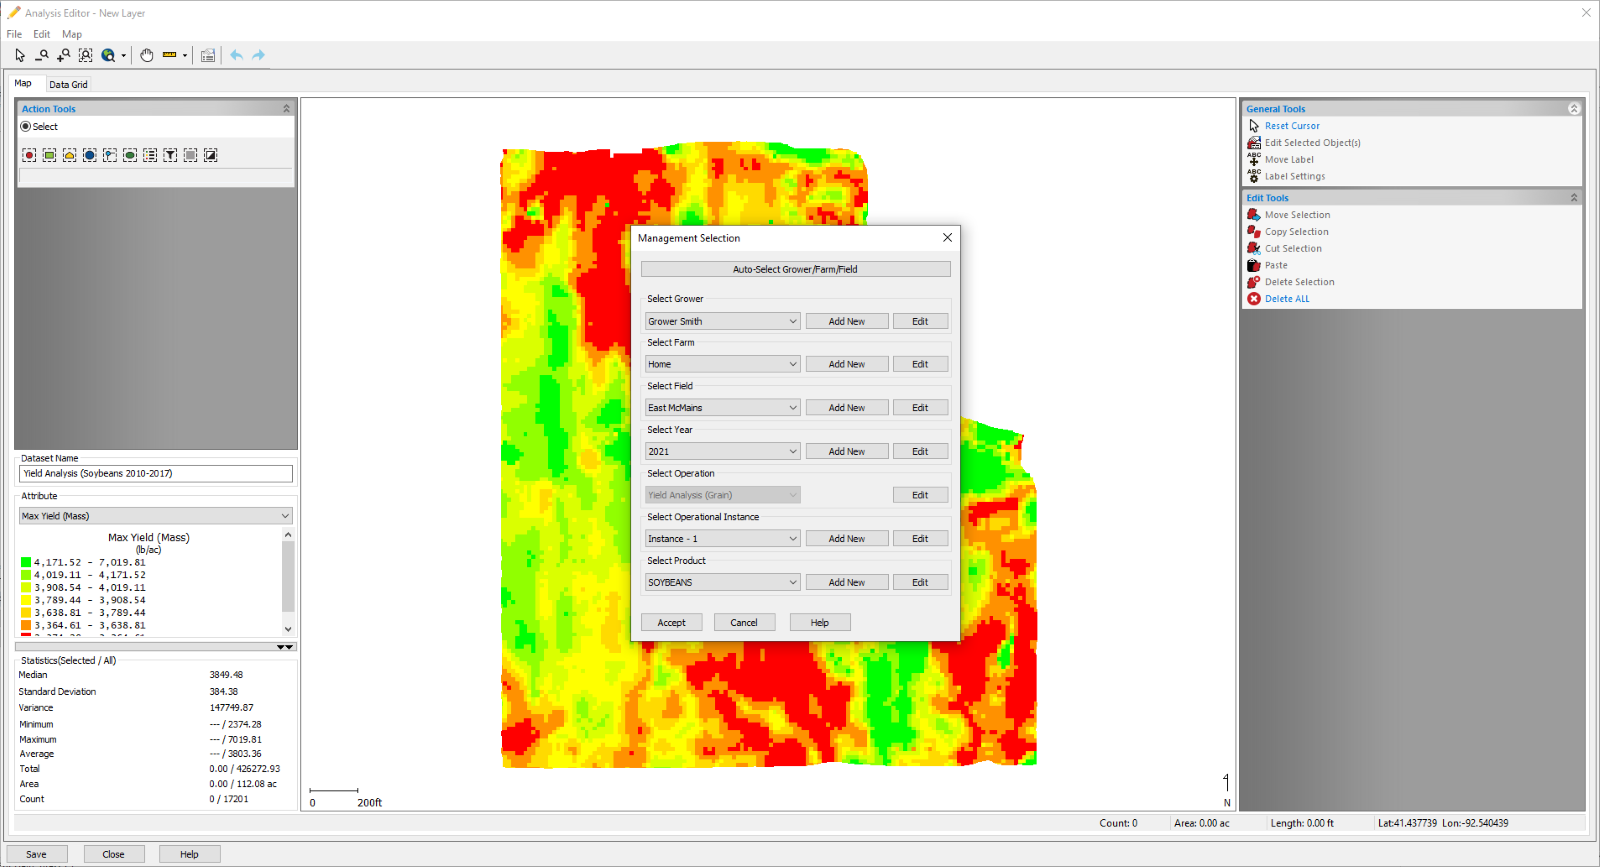
After processing, a preview will appear in the Analysis Editor Window.
-
Save the layer to the management tree.
-
It Is recommended to save it to the same year as the most recent harvest data and to select the crop type as the product name.
-
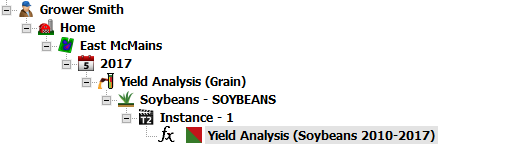
The analysis will appear under the operation “Yield Analysis (Grain)” in the management tree. The dataset will have the expand of years in parentheses the span of years the analysis was ran.
-
When creating a map of the Yield Analysis, the following layers are created and can be mapped:
-
Maximum Yield: SMS evaluates every spot in the field and evaluates the best yielding value over the number of years. This layer can be used for future yield goals or as a marketing risk management tool for selling grain.
-
Highest Yielding Product: Identifies the variety that was planted to achieve the maximum yield. This can be used to determine which varieties should be planted in certain areas of the field.
-
Highest Yielding Year: Identified which years produced the maximum yield in different regions across a field.
-
Minimum Yield: Identified the lowest yielding zones in each field. This can be used for marketing purposes when selling grain or quantify potential improvements (install tile).
-
Yield Spread = Maximum Yield – Minimum Yield. Lower values indicate greater stability in yield trends.
-
Yield: Average yield across all the years included in the analysis.
-
Yield Gap = Maximum Yield - Most Current Yield. This can be used to try to identify the changes of the current year compared to the best yielding year (if it was a hybrid change, fertility problem, etc).
-
Corn: Values over 50 bu/ac will be highlighted.
-
Soybeans: Values over 25 bu/ac will be highlighted.
-
Yield Growth = Most Current Year – Average Yield. The positive values show what was improved over time. The negative values show the differences between the current year yield compared to other years past.
-
Corn: Gray range is 10 bu/ac.
-
Soybeans: Gray range is 3 bu/ac.
-
Normalized Yield (Dry) (Mean): An average part of the field has a value of 100.
-
Values greater than 100 are above the average yield.
-
Values below 100 are below the average yield.
-
Yield Variability: A perspective of stable areas of the field.
Note: The attributes generated in the yield analysis can be ran on a general report.