The Agronomic Analysis will reference a single harvest crop year and the inputs (applied nutrients and seed) that were used to produce it.
-
Select Analysis Wizard.
-
Select Agronomic Analysis.
-
This analysis does not save custom settings/setup. Select “Single Field” or “Multiple Fields”.
-
Select the Data Filters. Select desired Grower, Farm, Field, Year, Operation and Crop Type. Click Next.
-
If needed, delete unwanted datasets from the list in the Edit Data Filter Results. Click Next.
-
In the Grid Options window, the grid settings can be modified by unchecking “Auto Set Gridding/Interpolation”. Click Next.
-
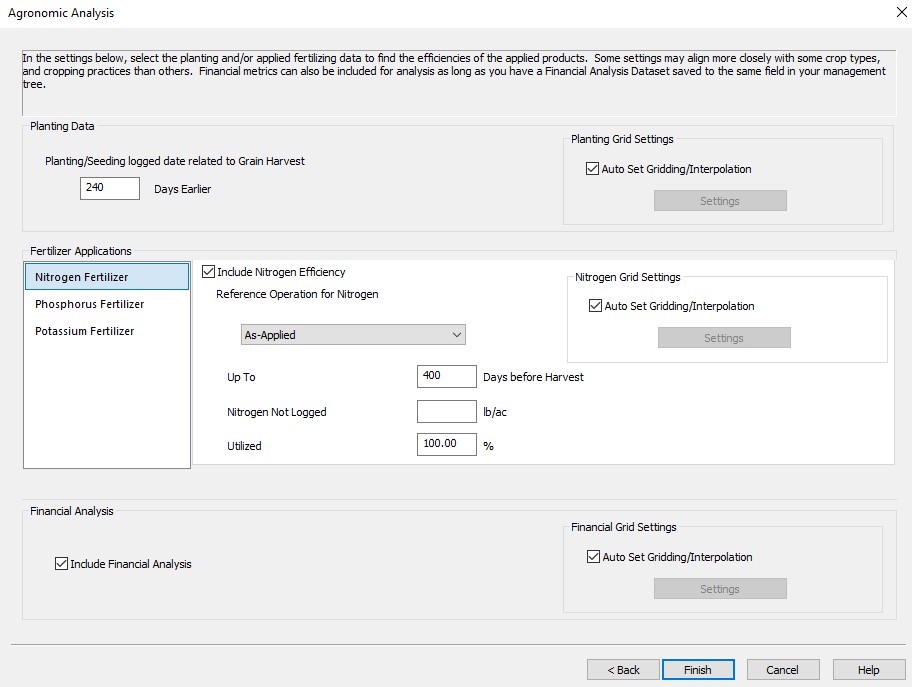
In the Agronomic Analysis window, adjust desired settings for the data that has been applied to the field:
-
Under Planting/Seeding logged date related to Grain Harvest select the number of days before harvest the planting operation happened for this field. The default time is set to 240 days earlier than harvest. The system will search for the most recent planting operation found from the harvest day back within the days specified.
-
Under Fertilizer Applications, select any applied fertilizer of N, P and K.
-
If a fertilizer was not used, uncheck the box “Include Nutrient Efficiency".
-
The information can be referenced from As-Applied data, Prescriptions or Crop Plan, if the product is saved as the nutrient applied.
- If using prescription or crop plan there needs to be a target date set. This is set by expanding the prescription all the way to the red and green square and right click to edit item. Then enter a target date for the application.
-
Note: If multiple applications for a nutrient are detected (for example N), where there are datasets of NH3 and other dry applications of DAP that contains N, SMS will add the layers together and will have a total amount of N applied.
-
The “Up To” value specifies the number of days that the fertilizer was applied prior to the harvest date. The default time is set to 400 days before harvest.
-
The “Nutrient Not Logged” value is related to any additional fertilizer that was applied, but not metered.
-
The “Utilized” value is related to the percentage of fertilizer that was available to the crop. The user can adjust this value to reflect what the crop was able to access.
- Include Financial Analysis will also add profit/loss as a viewable attribute in the generated agronomic analysis map
- The Interpolation settings can be modified by unchecking “Auto Set Gridding/Interpolation” and select “Settings”.
-
Select Finish.
-
After processing, a preview will appear in the Analysis Editor Window.
-
Save the layer to the management tree.
-
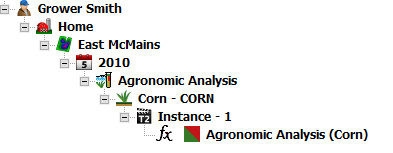
The analysis will appear under the operation “Agronomic Analysis” in the management tree. The dataset name will default to the crop type that was processed.
-
The layers created will show Seed, Nitrogen, Phosphorous and Potassium Efficiencies. The end goal is to show the user how much the applied inputs were utilized in the crop.
-
Seed Efficiency = Yield/plant population * 1000. For Corn, a value of 7 bu/ksds gives a general goal for maximizing planting rates.
-
Nitrogen Efficiency = Total amount of Applied N / Total amount of bushels harvested (Yield). Traditional recommendations state 1.2 lbs of Nitrogen for every bushel of yield is the goal, this provides a benchmark of what the fields produce with the applied data.
-
Phosphorous/Potassium Applied = Total amount of Applied Nutrient / Yield. These calculations allow the user to identify any patterns within the data to use in future years.
Note: The attributes generated in the yield analysis can be ran on a general report.