Access the following article for more information regarding SMS feature icons:
Opening SMS (Basic vs. Advanced)
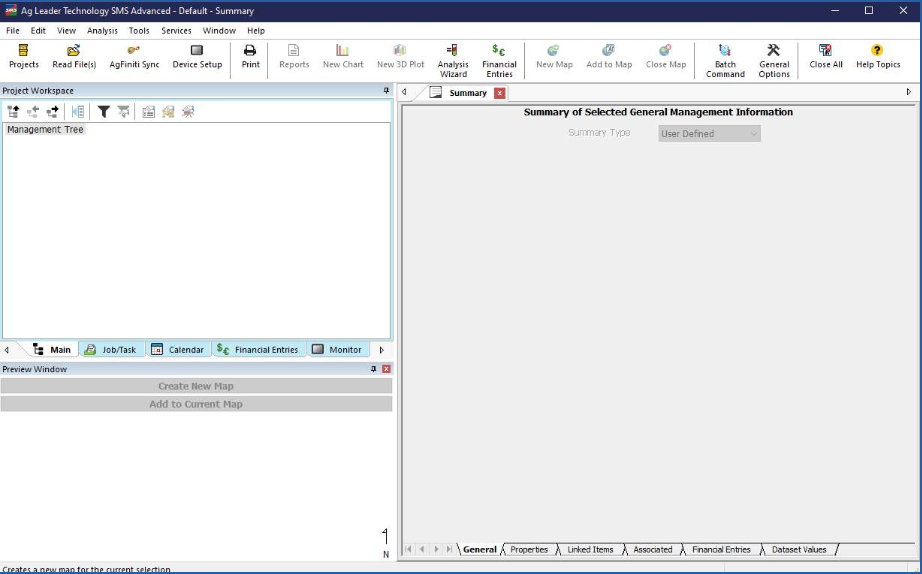
SMS opens differently between basic and advanced. For Basic users, after double-clicking the desktop icon, SMS will display the last project being worked on when SMS was closed. If it is your first time opening SMS, it will open a blank project.
For Advanced users, after selecting the SMS icon from the desktop, SMS will display the SMS Projects window. Here will be a list of all the projects you have created. If it is your first time opening SMS, you will be prompted to create a new project. Once you have either created or selected the project in this window, click open.
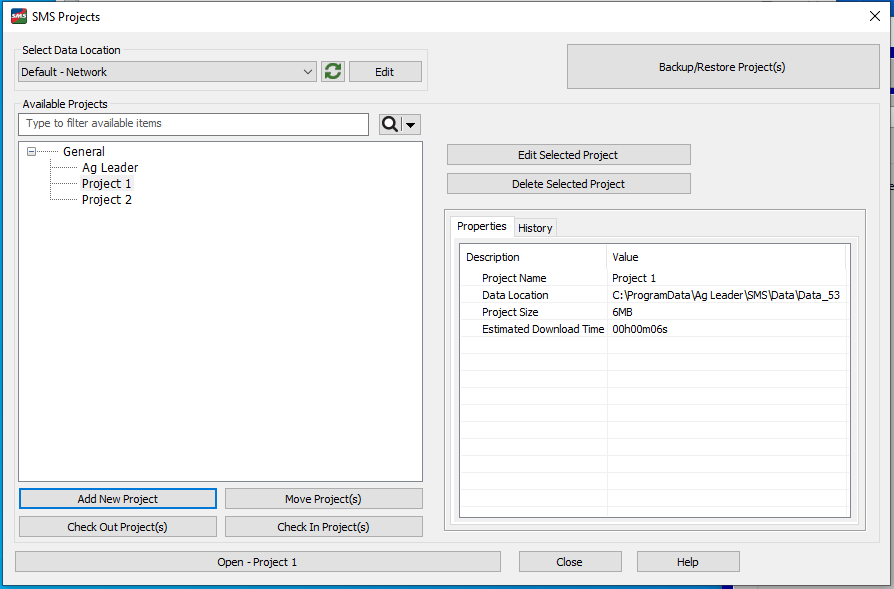
SMS Basic users can also get to this window by selecting File - Projects in the top left of the SMS page. However, Basic users can only have up to 5 different projects and basic users cannot have multiple data locations. (Advanced users can have unlimited projects and data locations)
Management Tree Toolbar
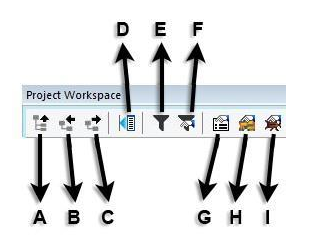
- A. Collapse Click this button to collapse the entire management tree, closing all the branches that are currently open to the Grower Level.
- B. Collapse Item Click this button to collapse the management tree up to the currently selected level in the tree.
- C. Expand Item Click this button to expand the management tree below the currently selected level, opening all branches below the current selection.
- D. Show Management Tree Menu Click this button to open the Management Tree Menu. This menu can also be opened by right clicking your mouse in the management tree window.
- E. Enable/Disable Management Tree Filter Click this button to enable or disable the Management Tree filter. Once a filter is set you can use this button to toggle the filter on and off without having to reset or clear your filter manually.
- F. Edit Management Tree Filter Click this button to open a Data Filter dialog that allows you to select the management items and/or date ranges for data that you would like to be displayed in the Management Tree. For example, you can select a Year filter to only show data from the current year in the Management Tree.
- G. Edit Item Click this button to view and/or edit the settings or properties for a selected item in the management tree.
- H. Edit Resource Tracking Click this button to assign or edit resources that can be assigned to a dataset, such as an Operator, Vehicle, Implement, and Containers.
- I. Edit Pest Click this button to assign or edit a Pest that can be assigned to a dataset. A Pest can be assigned to any dataset and not just Scouting datasets
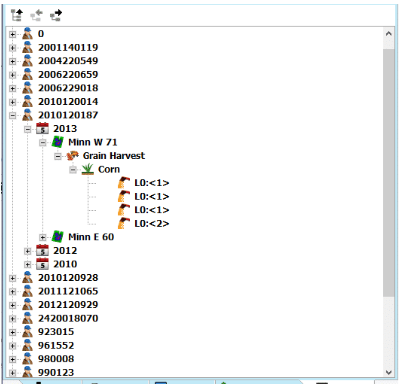
Management Tree
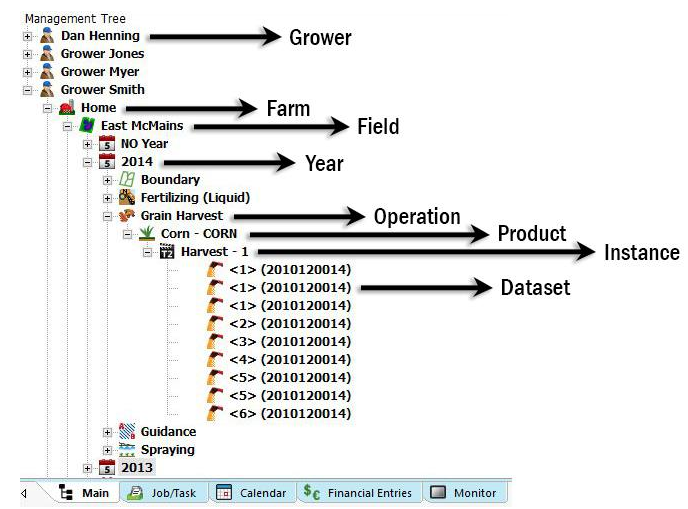
Management Tree Tabs
As you can see in the picture above, along the bottom it shows tabs such as Main, Job/Task, Calendar, Financial Entries, and Monitor.
- Main
- This is the default Management Tree that you learned about above.
- Job/Task
- This tree allows you to select, view and edit Jobs and Tasks that you have created. A Job is one or more Tasks that you plan on occurring during a specified time period. A Task is simply an operation that you plan to complete in a specific field, at a specific time.
- Calendar
- Calendar view provides access to your data based on when it was actually logged or is scheduled to happen. You can view summary data and make maps from this tab.
- Financial Entries
- This tree allows you to add, edit, delete and view Financial Tracking entries.
- Monitor
-
This tab displays the same data that is visible in the Main tab, except it is exactly as it was recorded in the field display or monitor. This tree is broken down by: Monitor Serial Number, Year, Field Name, Operation, Product and Dataset.
Preview WindowThe Preview Window allows you to quickly and easily see if spatial data exists for a selection(s) in the Management Tree. It is a powerful tool that allows you to decide what data to create a new map of or add as a layer on an existing map.
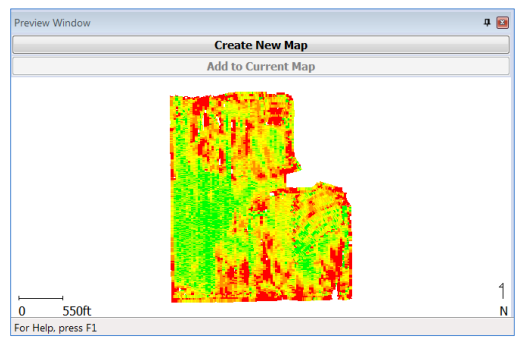
Create New Map Button- Click this button when it is bold to add the data in the window below to a new main map window.
Add to Current Map Button- Click this button when it is bold to add a new layer to the active map using the data shown in the window below.