For more information regarding plot prescriptions, reference the following articles:
Building a Plot Prescription
- Create a map of the data you wish to use as the reference layer for your plot prescription.
- Go to File -> New -> Plot Prescription
- The Enter Field Plot Settings dialog will now open where you will establish the settings for the plot
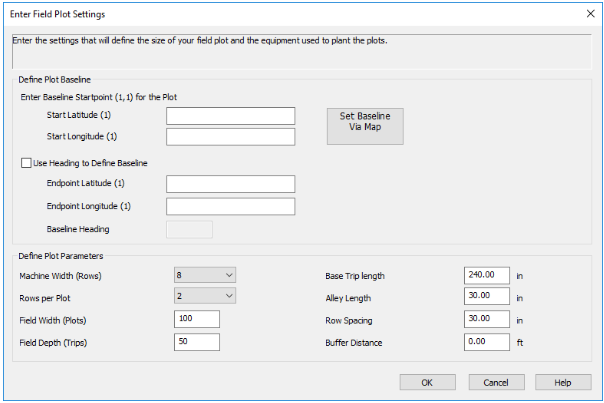
- The plot baseline determines where the first range of cells in the plot will start. There are several ways to define the plot baseline: by entering in the A and B coordinates, Set Via the Map, or by typing in the coordinates for the A point and then heading to drive. There will need to be a start point and endpoint entered here.
- If you use the Set Baseline Via Map tool, the Set Field Plot Baseline dialog will open with all reference maps displayed. Left click once to add the A point and left click again to finish the baseline and add the B point. As the baseline is being drawn a tooltip displaying the length and heading will be displayed.
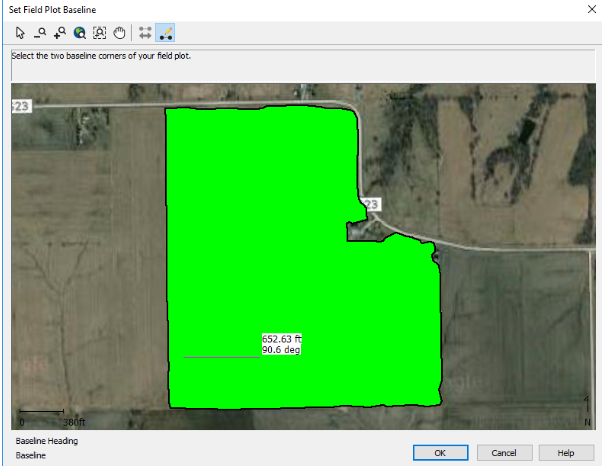
- If the baseline needs adjusted use the Move Baseline tool to move the A and B points and fine-tune where the plot is located at in the field.
- After the baseline has been created click OK
- On the Enter Field Plot Settings dialog use the Define Plot Parameters to establish the machine width, number of rows per plot, field width, field depth, base trip length, alley length, row spacing and buffer distance.
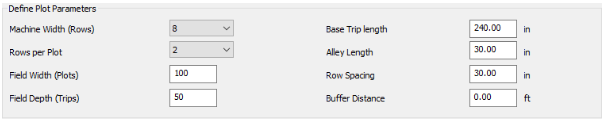
- Click OK to complete the plot setup
- The field plot will now be displayed. The origin of the baseline will be displayed on the plot with a label of “O”. The origin represents Plot 1-1 and each cell represents a planter pass and 1 trip.
- Click the Edit Seed Count|Trips button to define the rate and trips for the plot.
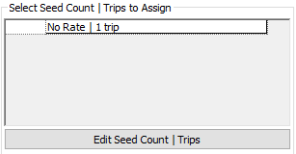
- On the Define Plot Rates|Trips dialog enter Seed Count or Seed Rate and the Trip Count. Enter the Seed Rate and number of Trips and click Add to move the pair to the right. These values will automatically sort lowest to highest.
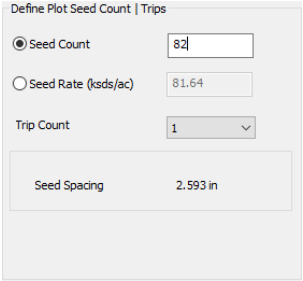
Note: If using the Seed Rate (ksds/ac) enter “32” to plant 32,000 seeds per acre. This value will be rounded up to the nearest whole seed for the Seed Count|Trip setting
- The Seed Spacing will be calculated and displayed based on the user-entered Seed Count.
- To Edit or Delete a rate that has been added, select it and click the Edit or Delete button.
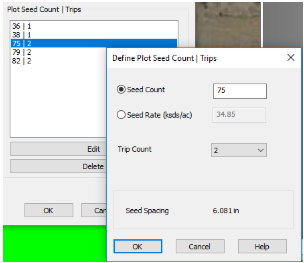
- Click OK after entering all desired Seed Count and Trip combinations
- To begin assigning seed counts to the plot, select the area to assign the first rate to by choosing the Select Plot tool and left click and drag to select all desired cells.
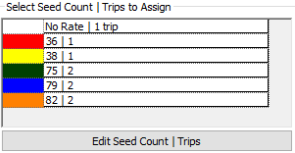
- To assign a seed rate to the selected plots click on the appropriate Seed Count|Trips in the legend window. The selected plots will now display the color and rate.
- Once all rates have been assigned and the plot appears as desired, click the Save button to store the prescription in the management tree