For more information regarding plot prescriptions, reference the following articles:
Editing a Plot Prescription
- To edit a plot prescription create a map of the prescription that needs modified and right click on the map and click Edit Layer
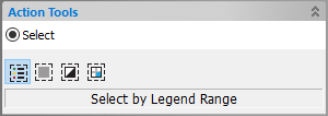
- Using the selection tools, highlight the area in the plot that needs updated and make the appropriate changes. In addition to the Select Plot tool there are other selection tools available:
- Select by Legend Range allows users to highlight one plot in the layer and all other plots with the same seed ratewill be automatically selected. This tool is very useful if an entire rate needs to be modified or removed from the prescription.
- Select All will select all plots in the prescription layer
-
Invert Selection will automatically select all points that were not previously selected.
-
If the placement of the plot needs adjusted there are several tools available to accomplish this.
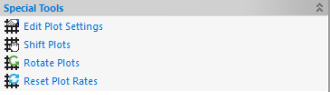
- Edit Plot Settings will open the Plot Settings dialog where the baseline can be adjusted as well as all plot parameters
- Shift Plots allows the user to move the plot to other locations in the field
- Rotate Plot allows the user to rotate the plot using the origin location as a pivot point
- Reset Plot Rates removes all seed rates that have been assigned
Adding a Buffer to a Plot Prescription
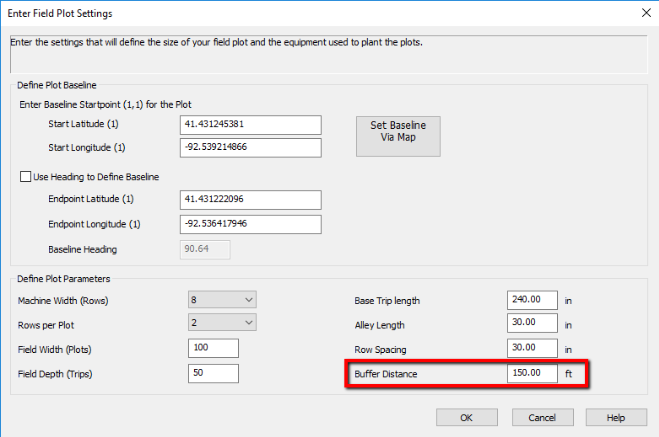
The buffer tool allows you to add a buffer around the plot prescription. This will allow you to enter the distance in feet that is needed around the plot for a buffer. This allows for a reference point for pollination setbacks or obstacles in the field.
To add a buffer enter the Buffer Distance on the Plot Settings dialog.
- Click Show Buffer in the editor window
- The buffer will now be displayed around the plot
- After making necessary adjustments to the buffer, click Save
Modifying Plot Display Settings
- Create new map of a plot prescription, and right click on the map and select Edit Layer Options
- Go to the Attribute Options tab on the left hand side of the dialog and click on the Plot Prescription tab
- On the Plot Prescription tab the display options can be customized including labels, buffer display settings and line width options.
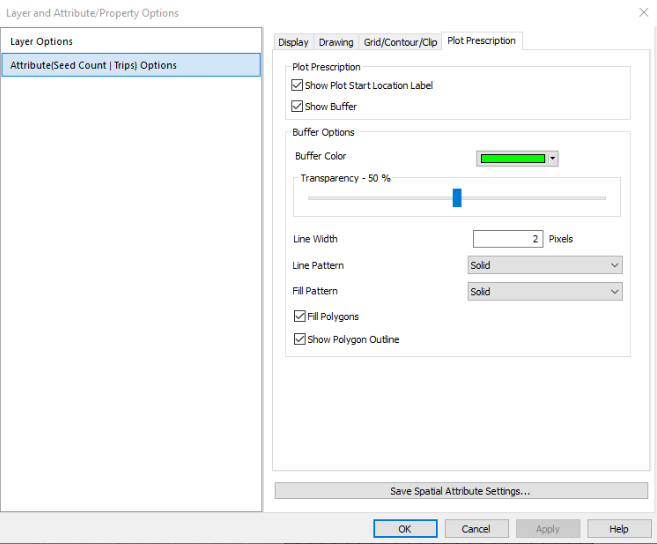
To save these custom settings click on the Save Spatial Attribute Settings button and check the Operation Default box. Saving these settings as the operational default will apply these settings to all plot prescriptions that are currently saved in the management tree, as well as all new prescriptions that get created.